|


|
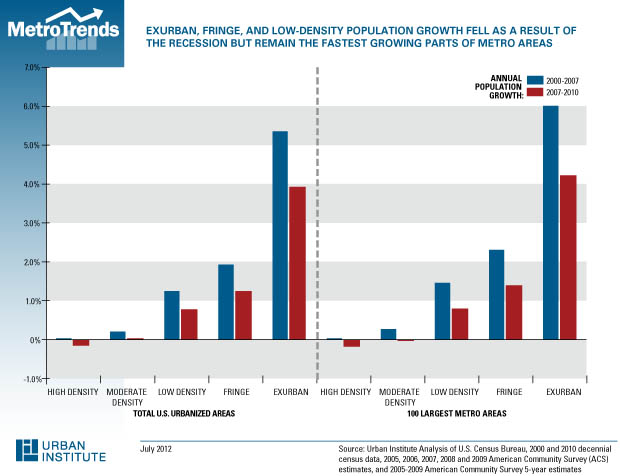
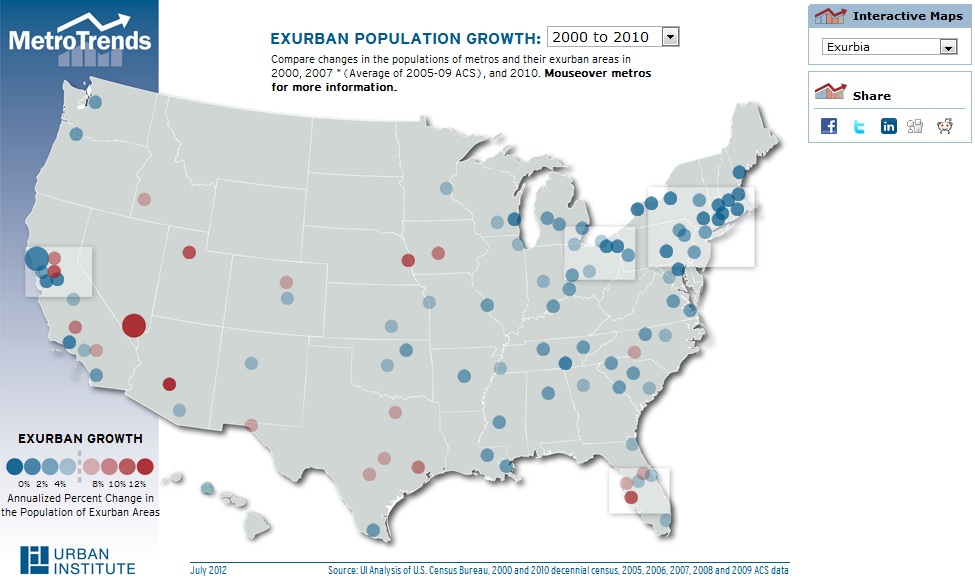
Exurban Population Growth Population Growth in the Exurbs Before and Since the Great RecessionData Source: Exurbia Housing patterns in the United States experienced substantial change over the 2000s. During the first half of the decade, exploding housing prices dramatically increased household wealth and boosted the performance of the overall economy. Many people purchased homes for the first time, or traded up to new, higher value properties. Starting around 2007, however, housing prices collapsed, dragging the rest of the U.S. economy down with them. This sudden reversal has had a dramatic effect on households' locational decisions. Residential mobility has declined, as people with "underwater" mortgages cannot easily sell their houses, and population growth is down across metropolitan America. But in most of the 100 largest metros, growth remains higher in the exurbs than in older, denser areas closer to the core. However, not all parts of the nation have been affected equally: some metropolitan areas weathered the storm better than others, and even within specific metros, the effects were not equally distributed. Over the last decade, the rate of growth in exurbia far outpaced that of the United States as a whole. Between 2000 and 2010, the U.S. population grew from about 281 million people to 309 million people, or about a 10% increase. During the same period, the exurban population grew from about 16 million to almost 26 million people, an over 60% increase. In both cases, the growth rate slowed substantially after 2007: the overall U.S. population grew by 7% from 2000 to 2007 (averaging about 1% annually), but by just over 2% from 2007 to 2010 (only about 0.8% annually). Meanwhile, the exurban population grew by 44% from 2000 to 2007 (about 6% annually), but by only about 12% from 2007 to 2010 (about 4% annually). This pattern is even more pronounced when looking at large metropolitan areas. Specifically, in the nation's 100 largest metros, the exurban population increased by over 70% between 2000 and 2010, from 11 million to almost 19 million people, while the overall population grew by less than 12%. As with the entire United States, growth in the large metros slowed dramatically after the middle of the decade, but the exurbs remained the fastest growing areas within these metros. Specifically, the exurban population of the 100 biggest metros grew by 50% from 2000 to 2007 (averaging about 7% annually), compared to around 13% from 2007 to 2010 (4.4% annually), while the overall population of these metros grew by 9% from 2000 to 2007 (averaging 1.3% annually) and 2.4% from 2007 to 2010 (about 0.8% annually). Not surprisingly, this broad national picture obscures some interesting differences between metropolitan areas. For example, whereas the overall population of metropolitan Houston grew by over a quarter during the 2000s, its exurban population more than doubled. Phoenix's exurbs experienced even more explosive growth, with a nearly 300% increase, compared to a 29% increase for the metro area as a whole. (Admittedly, this is partly due to the small starting population - only about 160,000 people lived in Phoenix's exurbs in 2000.) Most dramatically, Las Vegas's exurbs grew by nearly 400% during the decade, while metropolitan Las Vegas grew by just over 40%. The only metros in which the exurbs grew at a slower rate than the rest of the region were Modesto and Santa Rosa-Petaluma, CA, but both of these areas had very small exurban populations to begin with. A few other metros saw exurban growth similar to that for the region as a whole. In San Jose, constrained as it is geographically, the exurban population came closest to the overall picture: a 9% growth in the exurbs compared to about 6% for the overall population. Hartford was similar: its exurbs grew by 8% while its overall population grew by just under 6%. Exurbia can even grow when a metro's total population is shrinking. In Detroit, for example, the population shrank by 3.5% from 2000 to 2010, at a time when its exurban population expanded by almost 27%. We see a similar pattern in Pittsburgh, where the overall population declined about 3% from 2000 to 2010 while its exurbs grew by 28%. New Orleans provides the starkest illustration of this pattern - its overall population fell by over 11% from 2000 to 2010, while its exurbs grew by nearly a third. While several metro areas lost population from 2000 to 2010, in none of the 100 largest metros did the exurban population shrink. Over the decade as a whole, exurban census tracts grew faster than their metro areas in the great majority of large metros. Even though exurban population growth rates declined after the housing crash, exurbia continued to be the fastest growing area type in roughly half of the 100 largest MSAs. In general, metros with the strongest exurban growth in the first years of the decade continued to show the largest exurban population gains in the latter years of the decade, albeit at a slower pace. For example, the exurban tracts in the Las Vegas area grew by 285% from 2000 to 2007 (averaging nearly 41% growth per year), and while the growth rate of these tracts slowed to 27% from 2007 to 2010 (9% annually), even that slower growth still left Las Vegas among the five metros with the fastest-growing exurban populations. In 22 of the largest 100 metros, the average annual growth rate in the exurbs from 2007 to 2010 was higher than that of the previous seven years. While most of these metros, such as Omaha and Toledo, had relatively small exurban populations in 2000, other areas, such as San Antonio and Columbia, SC, already had substantial exurban populations. These results illustrate the continued importance of the exurbs. Although land-use planners, environmentalists, and others concerned about sprawl and resource use decry their very existence, it is clear that the exurbs continue to house a significant share of the metropolitan population, and in fact account for much of the metropolitan population growth over the past decade. These areas have weathered the economic storm of the Great Recession; whether they are poised to continue their amazing growth of the past decade is as yet undetermined. In a previous commentary, we examined exurbia by using tract-level data from Census 2000. In that commentary, we defined exurbia using three characteristics of the built environment: (1) housing unit density, (2) age of the housing stock, and (3) commuting links to neighboring economic centers. This commentary uses the same definition for exurbia. It combines data from the 2000 and 2010 decennial censuses with aggregated American Community Survey (ACS) data from 2005-2009. The 2005-2009 ACS data averages to 2007, produces results roughly comparable to those using the single-year 2007 ACS data, and enables us to perform tract-level analyses for every metropolitan area. To ensure comparability across time, we used consistent census tract boundaries for all data points. Our findings would appear to be at odds with recent statements from William Frey, who reported in the New York Times that the exurbs were the areas hardest hit by the housing crash. These contrasting results arise in part from methodological differences. For example, our study uses census tracts as the basic geographic unit, while Frey uses counties. Also, his article includes the period from 2010 to 2011, while this commentary focuses on the previous decade. This work is released to inform interested parties of ongoing research and to encourage discussion of work in progress. Any views or opinions expressed in the paper are the authors' own and do not necessarily reflect the views or opinions of the U.S. Census Bureau. |
Experts Feedback
Send us your comments to help further the discussion. Share
Commentaries
|