
|


|
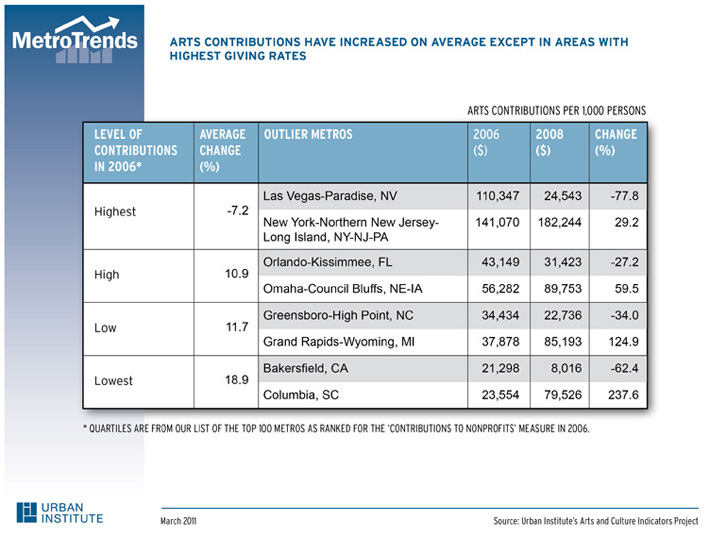
Arts and Culture In Stormy Economy, Cultural Vitality Faces Mixed ForecastIn today's difficult economic climate, it's often hard to find much good news. But challenges may be creating some opportunity for one important aspect of our communities—artists. For several years now, the Urban Institute's Arts and Culture Indicators Project (ACIP) has tracked various aspects of cultural vitality. Participation in cultural activity has been linked to greater levels of civic engagement and social cohesion, higher appreciation and tolerance for diversity, better education outcomes for children and also several positive economic outcomes. Artists, fueled by imagination, innovation and the spirit of possibility often take on the challenges and problems of cities and towns with fresh ideas and new approaches. They also are frequently important catalysts for development and new investment as they help to enliven areas that have been disinvested and neglected. In the face of unprecedented financial hardship, analysis of ACIP data shows that between 2006 and 2008, the number of artists actually increased. During this time, 77 of the top 100 MSAs experienced modest to significant positive change in the number of artists per thousand people. This trend is evident even in places that have suffered declines in both home values and jobs—"double trouble." Twenty-four of these 30 metros experienced an increase and twelve saw their numbers grow by 10% or more: Akron, OH (13.1%), Baltimore-Towson, MD (16.2%), Cleveland-Elyria-Mentor, OH (12.9%), Honolulu, HI (12.1%), Jacksonville, FL (11.5%), Lakeland-Winter Haven, FL (10.6%), Los Angeles-Long Beach-Santa Ana, CA (19.6%), Modesto, CA (12.7%), Oxnard-Thousand Oaks-Ventura, CA (14.8%), Palm Bay-Melbourne-Titusville, FL (17.5%), Poughkeepsie-Newburgh-Middletown, NY (13.7%), and Stockton, CA (13.5%). This preliminary analysis may confirm local and national stories that artists are moving to communities that have experienced significant economic distress and have been otherwise neglected and abandoned (see New York Times; Wall Street Journal). The growing emergence of creative people in distressed places surely is a trend worth following and encouraging. Our measures of cultural vitality are not limited to number of artists. We also have been tracking commercial arts establishments and employment in this sector, nonprofit arts organizations and their expenditures and contributions and also nonprofit festivals and community celebrations. With this variety of measures, the picture of cultural vitality is not so straight forward. We found that from 2006-2008, commercial arts establishments dropped in 88 of the 100 top metros and 65 of the top 100 metros had a smaller share employed in arts-related industries in 2008 than in 2006. However, despite these declines, the nonprofit art sector actually grew. The number of arts nonprofits increased in 72 of the top 100 metros, and expenditures rose among nonprofits in 80 metros. Changes in contributions to nonprofit arts organizations were positive in 58 of 100 metros, but we begin to see some declines as well. The most significant positive and negative changes appear in the following table. These analyses prompt several important questions. Will artists help shape a new creative economy in some of these places? As artists make their mark, will they help us think about work in new ways? Will they make us be more mindful about creative contributions to society—beyond only economic impacts? What will communities need to sustain and promote artists' innovation and creativity? From what we are currently hearing from nonprofit arts administrators around the country about severe cutbacks and some organizational closures, there has been hardship since 2008 and will likely be rough times ahead. However, we are hopeful that at least some of the positive trends will continue and that we can use this opportunity to develop a better understanding of how the arts contribute to our communities.
|
Experts
Feedback
Send us your comments to help further the discussion. Share
Commentaries
|


 Maria Rosario Jackson