|
|
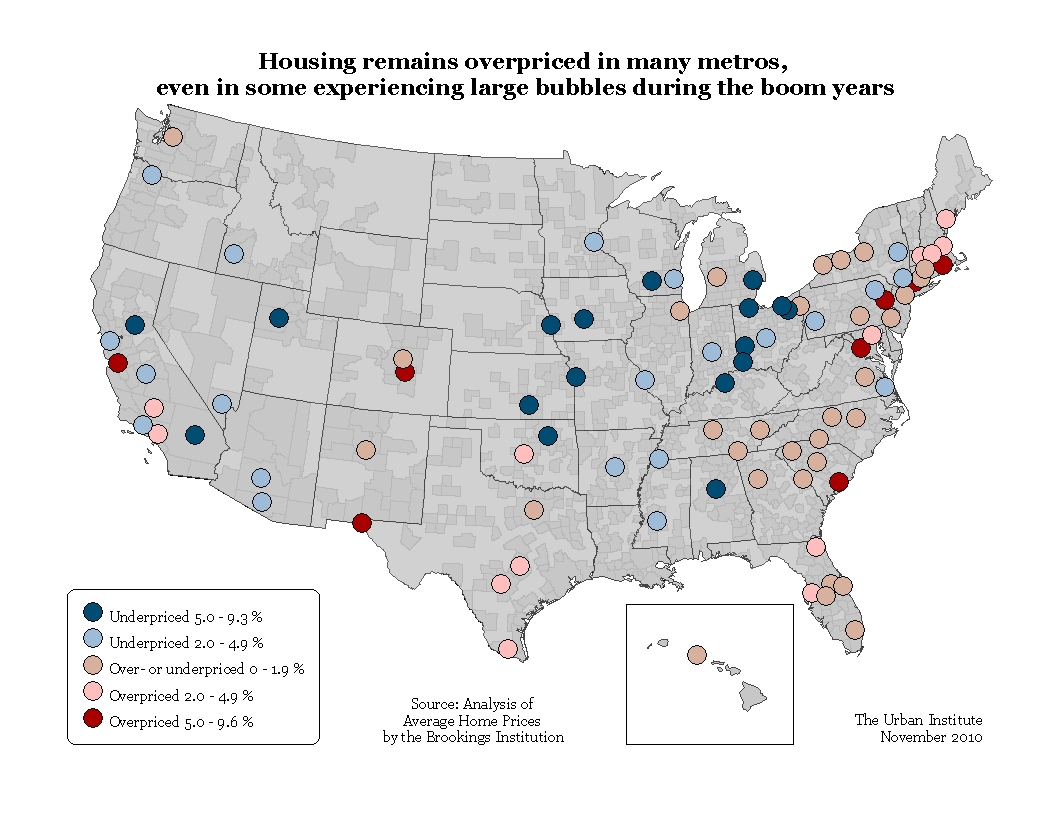
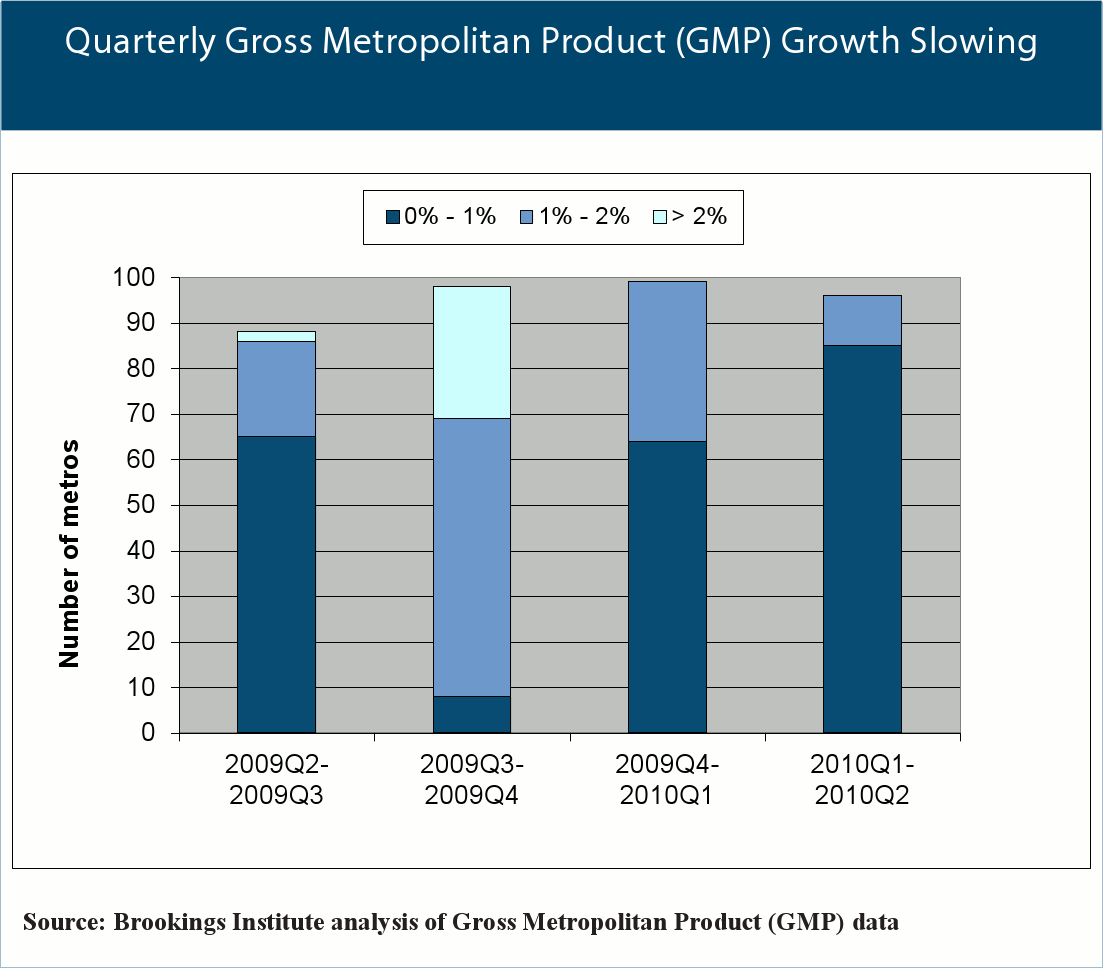
MetroMonitor MetroMonitor: Economy Still Sluggish in Most Major Metros (3rd Quarter, 2010)Nearly three years after the beginning of the Great Recession, the nation's economic recovery, jobless and fragile since its onset, seems to be running out of steam. Focusing on national aggregates, however, overlooks the fact that just as the American economy is not the same everywhere, neither was the recession and neither is the recovery. Each metro area economy had its own peaks and troughs in the housing market, employment, and output, which didn't necessarily correspond to those of the national recession and recovery. The most recent available data for the nation's 100 largest metropolitan areas paint a picture of a very uncertain economic recovery for most of these metros. House prices, the subject of a great deal of recent economic commentary, matter for the economic recovery of metropolitan areas because the value of owner-occupied housing is an important part of their economic output (gross metropolitan product) and a source of wealth that supports consumption of other goods and services. Except during housing price bubbles, a metro's house prices usually follow trends in the area's employment, wages, and interest rates (see methods note below). If prices are higher than would be expected on the basis of those trends then housing is considered overpriced; if they are lower then it is underpriced. Overpriced housing usually portends a fall in house prices, while underpriced housing typically foreshadows a rise, although a large inventory of foreclosed properties can delay that rise. In the second quarter of 2010, housing was underpriced by between 2 percent and 9.3 percent in 41 metropolitan areas, including some that experienced a large housing price boom and bust (Boise, Cape Coral, Fresno, Las Vegas, Oxnard, Phoenix, Riverside, Sacramento, San Francisco, and Tucson), all the large metropolitan areas of the Intermountain West, and most of the major Great Lakes metropolitan areas (Akron, Cincinnati, Cleveland, Columbus, Dayton, Des Moines, Detroit, Indianapolis, Louisville, Madison, Minneapolis, Milwaukee, Pittsburgh, St. Louis and Toledo). In those areas that had experienced housing bubbles during the boom years, these bubbles were more than fully deflated by the second quarter of 2010. Housing was overpriced by between 2 percent and 9.6 percent in 22 metropolitan areas, including some that had gone through a major housing boom and bust (Bakersfield, Jacksonville, Los Angeles, North Port, San Jose, and Tampa) and several in the Northeast and mid-Atlantic (Allentown, Baltimore, Boston, Portland (ME), Providence, Springfield, Washington, and Worcester). In these areas, which also experienced housing bubbles in the boom years, their housing bubbles were not yet fully deflated. In the remaining 31 metropolitan areas, housing was less than 2 percent under- or overpriced. This means that housing prices were near where they would be expected to be based on trends in employment, wages, and interest rates. House prices fell in the second quarter in all but six metropolitan areas (Buffalo, El Paso, Honolulu, Little Rock, McAllen, and San Jose). However, the rate of decline was slower in the second quarter than in the first quarter in 66 metropolitan areas, perhaps as a result of last-minute home sales stimulated by the now-expired federal homebuyer tax credits. Of the 34 metropolitan areas where the prices fell more rapidly in the second quarter than in the first, 11 (Bakersfield, Boise, Cape Coral, Fresno, Jacksonville, Lakeland, Orlando, Palm Bay, Phoenix, Sacramento, and Tampa) were among those where house prices fell most sharply from their peak levels, suggesting that markets in some of the metropolitan areas hit hardest by the housing crisis are not yet stabilizing. Foreclosures also continued to rise in most metropolitan areas in the second quarter of 2010. Eighty-two metropolitan areas saw increases in the number of real estate-owned (REO) properties during that quarter. However, seven of the 18 in which the number of REO properties declined (Bakersfield, Cape Coral, Los Angeles, Oxnard, Riverside, San Diego, and Stockton) were among those where house prices fell most sharply from their peak levels. Like the housing data, the recent job reports reinforce the tentative nature of the economic recovery in most large metropolitan areas. For the first time since the beginning of the national recession, a majority of large metropolitan areas (83) had job growth in the second quarter of this year, up from 36 in the first quarter. However, temporary Census hiring was responsible for some of this growth. Despite job growth in the second quarter of 2010, the jobs recovery has been unusually weak in most of those areas. Seventy-six of the 100 largest metropolitan areas have lost a larger share of jobs 10 quarters after the start of the Great Recession (the fourth quarter of 2007) than they did during the first 10 quarters after the start of any of the previous three national recessions. Ten quarters after the start of the national recession, the 100 largest metropolitan areas combined had lost 5.8 percent of the jobs they had before, compared to 2.0 percent for the 2001 recession, and 0.9 percent for the 1990?1991 recession. Ten quarters after the start of the 1981?1982 recession, employment in the 100 largest metropolitan areas had actually grown 2.9 percent. All but four of the 100 largest metropolitan areas (Jacksonville, Palm Bay, San Francisco, and Providence) had growth in output (gross metropolitan product) in the second quarter of 2010. However, this was actually a decline over the previous quarter in which 99 metropolitan areas saw output growth and 81 had growth rates outpace the second quarter. Even though a minority of metropolitan areas (41 metropolitan areas) had made a complete output recovery by the second quarter of 2010, only one metropolitan area (McAllen, TX) had also recovered its recent peak employment level. The data for the third quarter of the year may provide a better gauge of whether the economic recovery has continued to slow or even stop, or whether it strengthened. The national indicators suggest that the recovery remains sluggish but, as in the second quarter, the answer is likely to vary among metropolitan areas. A NOTE ON METHODS: Regression analysis for each metropolitan area was used to estimate the relationship, through the end of 1998 (prior to the housing bubble), between that area's average house price, its average house price in previous quarters, its employment, its average wage, and the mortgage interest rate. The results were used to predict average house prices in the second quarter of 2010 and actual average house prices were compared with predicted ones to estimate under- or overpricing. |
Experts Feedback
Send us your comments to help further the discussion. Share
Commentaries
|


