
|


|
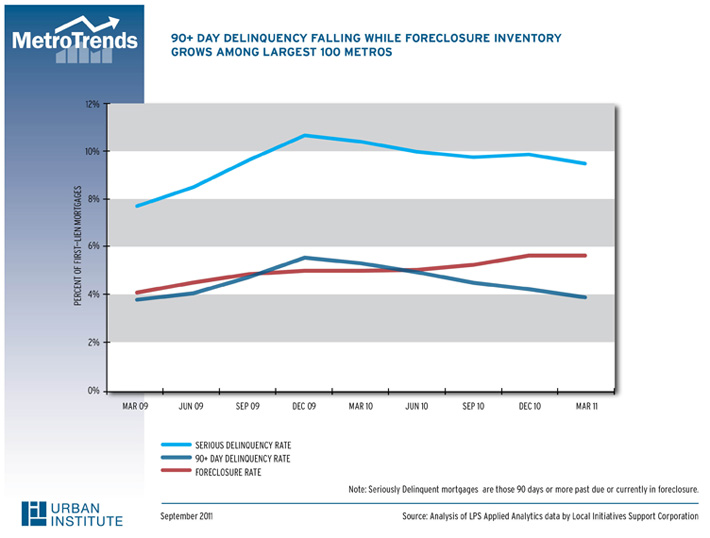
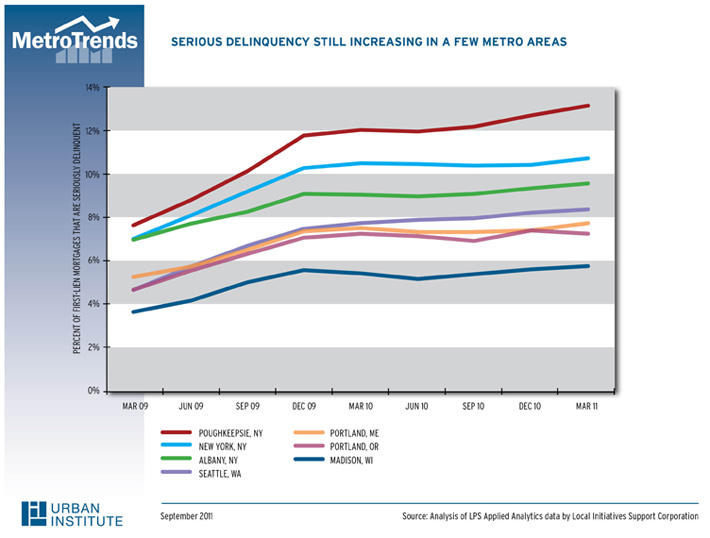
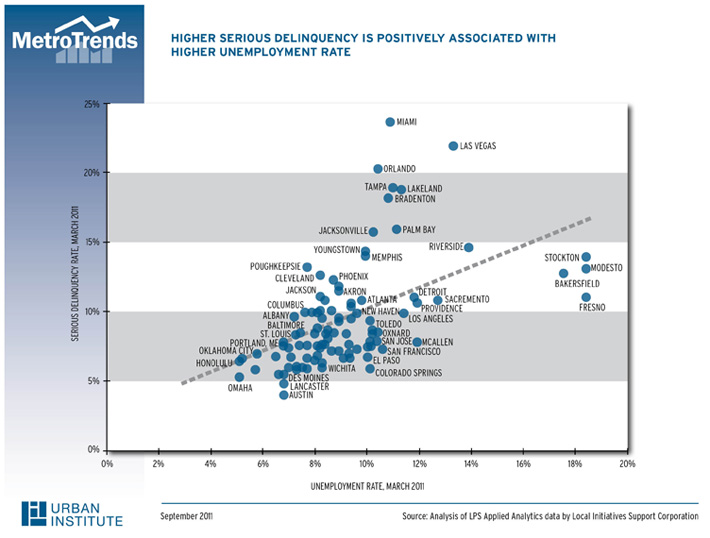
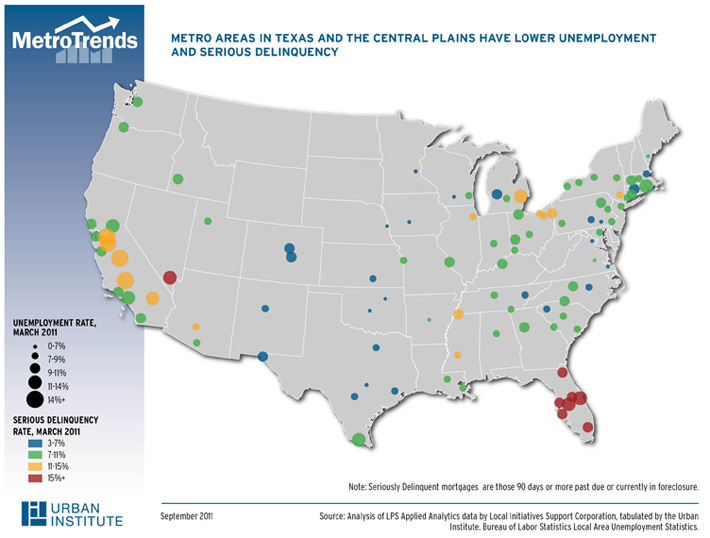
Serious Mortgage Delinquencies Serious Delinquency Rates - 100 Largest Metro Areas, March 2011For additional maps and data, including all 366 metropolitan areas, see Foreclosure-Response.org. Serious delinquency rates for mortgages continue to stabilize across the largest 100 U.S. metropolitan areas. Although serious delinquency has fallen about 10% from a peak of 10.5% in December 2009 to 9.4% in March 2011, it remains at historically high levels. Serious delinquency has two components that are currently moving in opposite directions. The first component, the 90+ day delinquency rate, fell from 5.5% in December 2009 to 3.9% in March 2011. The share of all mortgages at least 30 days delinquent is also decreasing. The second component, the foreclosure rate (the share of mortgages in the foreclosure process, also referred to as the foreclosure inventory), increased 12% during the same time period. LPS Applied Analytics's Mortgage Monitor presentations1 indicate that volume of foreclosure starts has been relatively flat, which suggests that properties are not exiting foreclosure, either through a foreclosure sale, loan modification or alternate resolution. These mortgages are remaining in the foreclosure inventory for an extended period of time. The serious delinquency rate is decreasing in all but 12 of the largest 100 metropolitan areas. The seven metros with the largest increases between December 2009 and March 2011 are depicted in the chart below. These increases are due primarily to the growth in the foreclosure rate in these areas. The Poughkeepsie, NY metropolitan area experienced an 11.9% rise in serious delinquency, followed closely by Seattle, WA at 11.8%. The other metro areas displayed on the chart had smaller increases of 3.0% to 5.7%. The remaining 5 metro areas not on the chart had smaller gains in serious delinquency, below 3%.2 Five of the 12 metro areas with growing serious delinquency are located in New York, the state with the longest foreclosure process. RealtyTrac reports that foreclosures take an average of 966 days from start to completion in New York.3 This analysis further examines the relationship in March 2011 between the unemployment rate and the serious delinquency rate in the top 100 metropolitan areas. As might be expected, higher unemployment is positively associated with higher serious delinquency, and in particular, higher 90+ day delinquency rate (see the chart below). The dotted line in the chart shows the predicted values of the serious delinquency rate at a given unemployment rate. Several metropolitan areas stand out as having higher serious delinquency rates than their unemployment rates would predict: Miami and several Florida metro areas, Las Vegas, as well as areas like Youngstown, Memphis and Poughkeepsie. Other metropolitan areas, particularly those in the Central Valley of California, have very high unemployment and lower serious delinquency than predicted for the average metro area. The map below looks at the geographic pattern of serious delinquency and unemployment in the largest 100 metropolitan areas. Low unemployment and serious delinquency rates in March 2011 are concentrated in the middle of the country, in Texas and the Central Plains states. Areas that have been hit hard by the foreclosure crisis and had significant home construction industries, like those in California, Nevada, and Florida, have both high serious delinquency and unemployment rates. Metro areas like Grand Rapids, Denver, Colorado Springs, and El Paso, have moderate unemployment but relatively lower serious delinquency, while a number of metropolitan areas including Atlanta, Boise, Charlotte, Dayton, Louisville, Portland, Scranton, Seattle, Springfield, and St. Louis, have both moderate unemployment and serious delinquency. 1 http://www.lpsvcs.com/LPSCorporateInformation/ResourceCenter/PressResources/Pages/MortgageMonitor.aspx 2 These metro areas include: Philadelphia, Syracuse, Tulsa, Bridgeport, and Buffalo. 3 http://www.realtytrac.com/content/press-releases/midyear-2011-us-foreclosure-market-report-6681 |
Experts
Feedback
Send us your comments to help further the discussion. Share
Commentaries
|


 Rob Pitingolo