
|


|
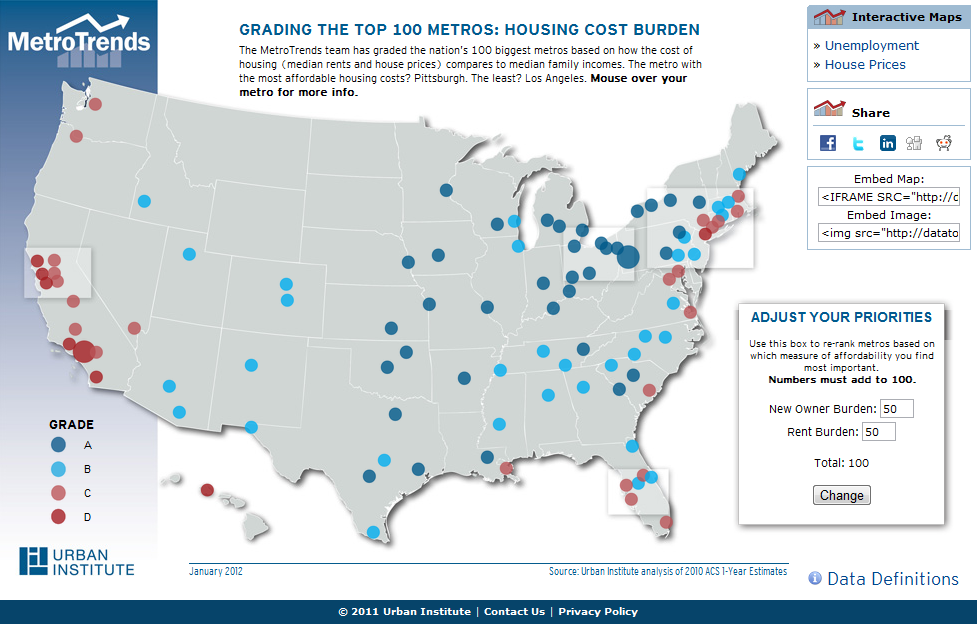
Ranking Metros' Housing Affordability Rethinking and Measuring Housing Affordability: How Do Metros Rank?How should we define and measure housing affordability across metro areas? The answer is far from clear since home prices vary dramatically by neighborhood, house size and quality, and ownership status. Every community will have a wide distribution of rents and home prices-and housing costs typically vary with incomes. In the short run, with housing supplies fixed, housing prices are determined by what people are willing to pay. The homes in each quality category will go to the highest bidders. Thus, people at the 75th percentile of incomes would live in houses at the 75th percentile of prices; those at the 50th percentile would buy homes in the 50th percentile of prices. If we think people should not have to spend more than 30 percent of their income on housing, the affordability question becomes: What quality of housing can low- and middle-income families buy? Housing policy advocates generally ask a different set of questions, such as: What share of income do families actually spend? What share of households spends more than 30 percent of their incomes on housing? And what income (or wage rate) does a household need to pay for decent housing? The National Low Income Housing Coalition (NLIHC) offered its answers in a recent report, concluding that: "For a household earning the average renter wage it is often exceedingly difficult to obtain decent housing. For the lowest income households, such as households earning the prevailing minimum wage, it is very nearly impossible." Yet, instead of asking about the quality of housing low-income families can afford with 30 percent of their incomes, the Coalition authors simply assume that decent housing is housing priced at fair market rents (FMR)-a rent level used by the Department of Housing and Urban Development for its Housing Choice voucher program. But the FMR is actually the rental price at the 40th percentile of local rents and not a direct measure of whether a dwelling is "decent." Now, we'd expect renters at the 40th percentile of incomes-not those at the 15th-20th percentile-to rent places at the 40th percentile of rent distribution. It is odd to say these homes and apartments are unaffordable because low-income families have to pay more than 30 percent of their incomes to rent at the middle of the price distribution. Of course, some low-income families may aspire to middle-priced homes and may be willing to pay more than 30 percent of their incomes to rent them. This does not show that if they spent less, they would not live in decent housing. It turns out that the FMR is far higher than the rent actually reported at the 40th percentile by all households. The reasons may be that the FMR calculations exclude public housing units and units less than two years old and include only renter households who moved to their present residence within the most recent 15 months. Still, it is interesting to note that the national average FMR is $960 per month for a two-bedroom unit, data from the American Community Survey (ACS) indicate that the 40th percentile price is about $770. In fact, even the median gross ACS rent ($855) is well below the FMR. If we focus on actual rent in relation to income and consumption, we find a more promising picture of affordability. Families at the median income (about $5,000 per month) need to pay about 17 percent of their incomes to rent the median-rent dwelling. Families around the 12th percentile of incomes (near $20,000 per year) can spend 30 percent or less of their incomes to rent a unit at the 20th percentile of rents (about $500/month). On average, low-income renter families spend about 25 percent of their consumption on housing, according to the Bureau of Labor Statistics. All this is not to diminish the very serious affordability problems faced by many low-income families. Homeownership brings another dimension to indicators of housing affordability. In many metropolitan areas-for families able to obtain credit at current interest rates-housing cost burdens have declined to surprisingly low levels. In 2010, a median-income family in the United States could buy a median-valued home (assuming no down payment and a 30-year, 4 percent mortgage) by paying only 17 percent of income. Families at the 25th percentile of income buying a home at the 25th percentile of home prices also can expect to pay only 17 percent of income1. With prices declining from 2010 through 2011, homeownership has become even more affordable today. Of course, for families to buy homes, they must gain access to mortgage credit, a task increasingly elusive in today's environment. So, given measures of rent and homeownership cost burdens for typical families, how do metro areas rank? The chart reflects metropolitan rankings based on a simple average of rent and homeowner affordability for median income families. According to this index, Pittsburgh, Wichita, Syracuse, Buffalo, and Youngstown were the most affordable metros in 2010 (rent burdens of 13 percent and homeownership burdens of 11-12 percent). Los Angeles, Honolulu, San Francisco, San Diego, and San Jose were least affordable (rent burdens of 18-23 percent and homeownership burdens of 34-42 percent). Overall, the figures reflect a high level of affordability. In all but the costliest 8 of the largest 99 metro areas, costs amounted to less than a quarter of income. In 81 areas, cost burdens were under 20 percent. 1The 17 percent figure is equal to the monthly mortgage payment (interest plus principal) divided by monthly income. Although it does not include property taxes and insurance, the mortgage payment includes savings in the form of principal repayment amounting to about one-third of the full payment. The National Association of Realtors estimates payments on the median home relative to median income at only 13 percent in the quarter of 2011. |
Experts
Feedback
Send us your comments to help further the discussion. Share
Commentaries
|
 Robert I. Lerman