
|


|
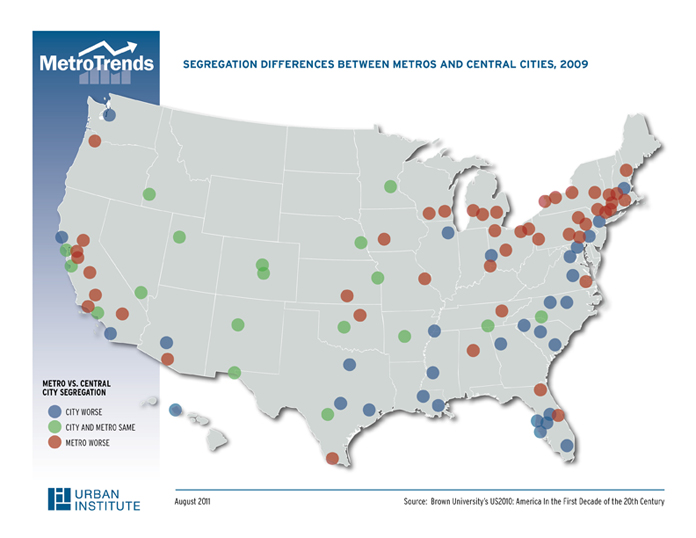
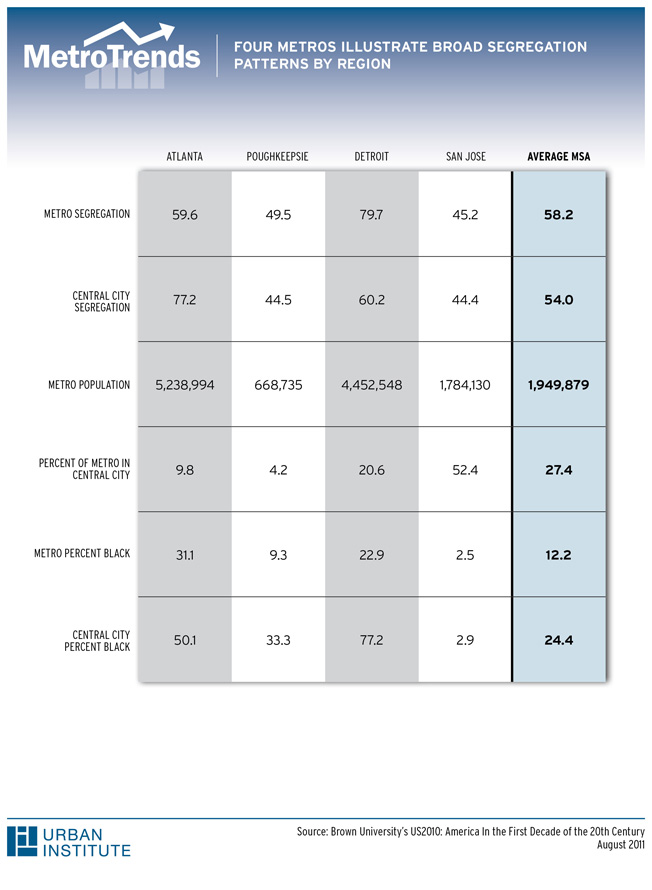
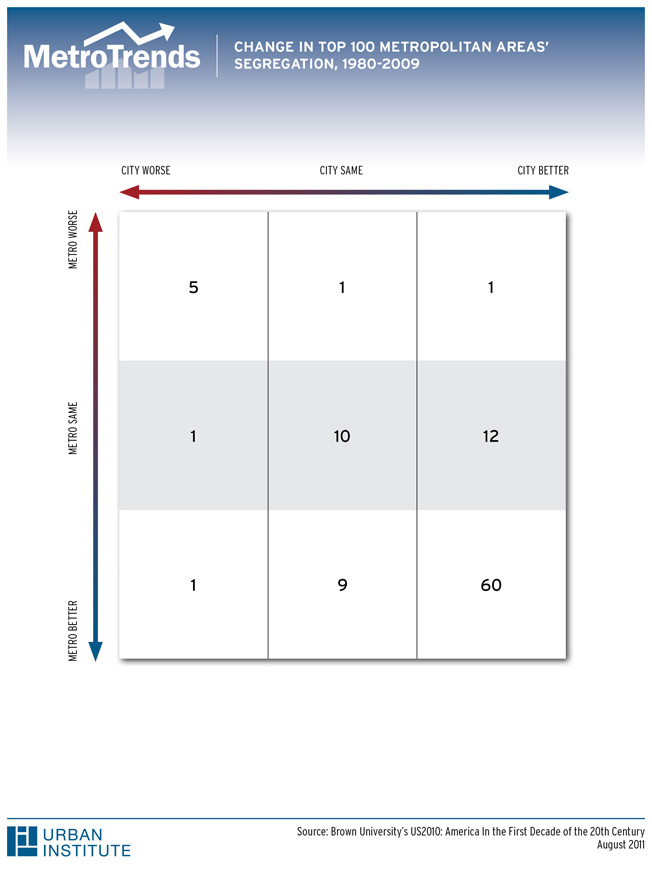
Neighborhood Diversity Broad Improvements Mask Stark Differences in Metropolitan Racial SegregationIn two previous commentaries, we explored the racial composition of the average white person's and the average black person's neighborhoods. Although both are considerably more diverse today than in 1980, the change is due primarily to increases in Hispanic populations, not to increased white-black mixing. Here we focus on the overall levels of black-white segregation in cities and their metropolitan regions using a measure called the dissimilarity index, a 0-100 scale with 100 signifying totally segregated populations. The dissimilarity index reflects the percentage of one racial group that would have to move in order to make its share of every neighborhood equal to its total population share. Racial segregation across cities and metros has generally declined over the last 30 years, dropping an average of 7.7 percentage points in the nation's top 100 metros and 10.1 percentage points in their central cities. Despite this decline, many metros remain highly segregated, and dramatic differences across metros, and between metros and their central cities, persist. Today, metropolitan segregation ranges from a low of 37.7 in El Paso, TX to a high of 81.0 in Milwaukee, WI. Within central cities, segregation ranges from a low of 14.8 in Middletown, NY to a high of 83.8 in Chicago, IL. In other words, some metros, and especially some central cities, have very low levels of segregation, while in others more than 80 percent of blacks would have to move to be equally represented in all neighborhoods. Three decades ago, most metropolitan black populations were concentrated in the central city, while the surrounding suburbs were much more predominantly white. Today, both cities and suburbs of most metro areas are more diverse. But how do levels of black-white segregation compare in central cities versus their larger metropolitan regions? In 26 of the top 100 metros, segregation is higher in the central city than in the surrounding metro. These are mostly big Southern metros with large black population shares. In contrast, in 42 mostly northeastern and western metros, segregation is markedly lower in the central city than in the metropolitan area. These metros are smaller, with small black populations concentrated within the central city. The 32 metros in which the city and metro have roughly the same levels of segregation are averaged-size with intermediate black population shares, located mostly in the West and Midwest. Although we see considerable diversity within regions, four prototypical metros illustrate these broad differences in metropolitan segregation patterns. Atlanta typifies large Southern metros with high central city segregation relative to the metro as a whole. The central city, which accounts for only 9.8 percent of the region's total population, is 50.1 percent black, with a segregation score of 77.2.Poughkeepsie, more typical of the Northeast, is in many ways Atlanta's opposite. Both the metro and its central city are much smaller and whiter, and their segregation scores are considerably lower. Although one third of the city's population is black, its segregation score is 44.5, compared to a regional score of 49.5. Midwestern Detroit paints yet a different picture. The Detroit metro is almost as large as Atlanta, and surprisingly, a much larger share of total population lives in the central city. However, the city of Detroit is predominantly black (77.2 percent), while the region as a whole is only 22.9 percent black. Segregation is very high in the Detroit region, but considerably lower in the central city, possibly because so few whites live there. Finally, San Jose typifies the metropolitan west. More than half the region's total population lives in the central city, and blacks account for very small shares of both city and regional populations (under 3 percent). Black-white segregation scores are quite low, and essentially the same in the central city and the metro as a whole. Despite these broad differences, most metros and their central cities have seen significant reductions in black-white segregation since 1980. Segregation waned in 70 of the top 100 metros, by an average of 11.3 percentage points. Bradenton-Sarasota-Venice, FL desegregated the most with a drop of nearly 26 percentage points in its segregation score, from 84.3 to 58.4. Seventy-three central cities desegregated, with an average decline of 14.9 percentage points in their segregation scores. Lancaster, PA out-paced other cities with a decline in segregation of nearly 33 percentage points, from 70.4 to 37.5. Of the top 100 metros, 60 saw reductions in segregation scores for both the central city and the metropolitan area as a whole since 1980. These 60 include metros of all sizes and all regions of the country. In the metros with the steepest declines, segregation started high -- at around 75. These high-population metros typically saw large increases in Hispanic populations and small changes (often reductions) in Black population shares. For example, Atlanta's metropolitan segregation score declined by 17.3 points since 1980, while its Hispanic population increased by 700 percent and its Black population grew by 25 percent. Of the ten metros experiencing the biggest reductions in black-white segregation, nine are in the south and six are in Florida. As a group, the average growth in Hispanic population was 378.4 percent, compared to 235.4 for all of the top 100 metros. Thus, big increases in Hispanic populations appear to contribute to -- or at least coincide with -- declines in black-white segregation. Las Vegas is the lone ?top tenner? outside of the south, with a decline in black-white segregation of nearly 24 percentage points. In contrast, segregation intensified in small, predominantly white western and mid-western metros. Though only five metros and their central cities have seen increases in black-white segregation scores since 1980, some became much more segregated. Boise is a stark example -- its city segregation score increased 20.2 points, while its metro score rose by 13.2. Typical of these metros, Boise is small with a rapidly growing black population -- climbing from 0.49 percent in 1980 to 1.34 percent today. In 1980, it had relatively low segregation scores (32.6 and 27.2 for the metro and city, respectively). Other metros with rising black-white segegation include McAllen, Portland, ME, Madison, and Salt Lake City. Although it is encouraging to see black-white segregation declining in most of the nation's top 100 metros as well as in their central cities, the persistence of high segregation scores across the country warrants continued policy attention. Residential segregation undermines the well-being of individuals, communities, and American society as a whole. Although we know much less about the potential benefits of neighborhood diversity than about the costs of segregation, considerable research finds that both whites and minorities gain from diverse communities. The goal of healthy, sustainable communities cannot be achieved as long as current levels of neighborhood segregation, exclusion, and inequality persist. Historically, public policies played a central role in establishing and enforcing patterns of racial segregation in American neighborhoods, alongside discriminatory practices by private sector institutions and individuals. But no single causal process explains the persistence of residential segregation in America today. Discrimination, information gaps, stereotypes and fears, and disparities in purchasing power all work together to perpetuate segregation, even though many Americans -- black and white -- say they want to live in more diverse neighborhoods. Because the causes of segregation are many and complex, and because patterns of segregation differ from one metro area to another, local policy makers should craft strategies that respond to local conditions and trends. For example, both metropolitan Atlanta and its central city remain highly segregated, despite considerable gains since 1980. Local governments and fair housing advocates should focus on strategies to continue opening up suburban neighborhoods -- through fair housing enforcement, education campaigns, and search assistance -- while preserving diversity in revitalizing city neighborhoods -- through affordable housing preservation and community building. In Boise, where racial diversity is new to the region, governments and nonprofits should be working together on vigorous fair housing enforcement and public education campaigns, and targeting investments in diversifying neighborhoods to protect against white flight and rigidifying segregation patterns.
|
Experts
Feedback
Send us your comments to help further the discussion. Share
Commentaries
|

 Margery Austin Turner
 Zachary McDade