
|


|
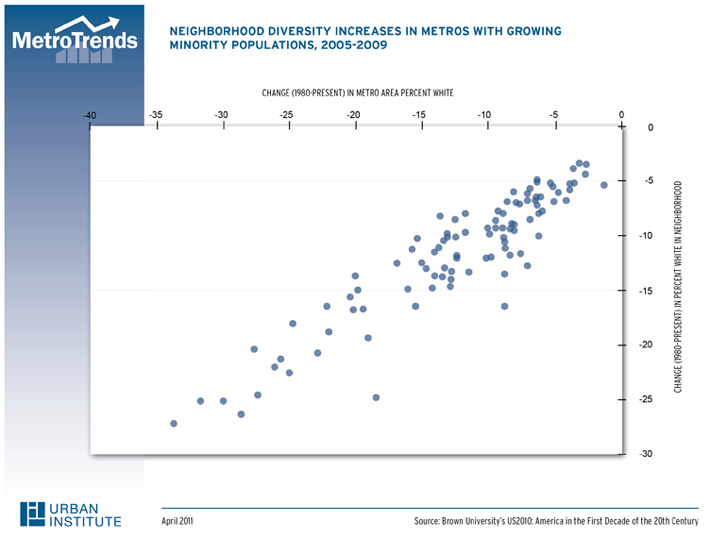
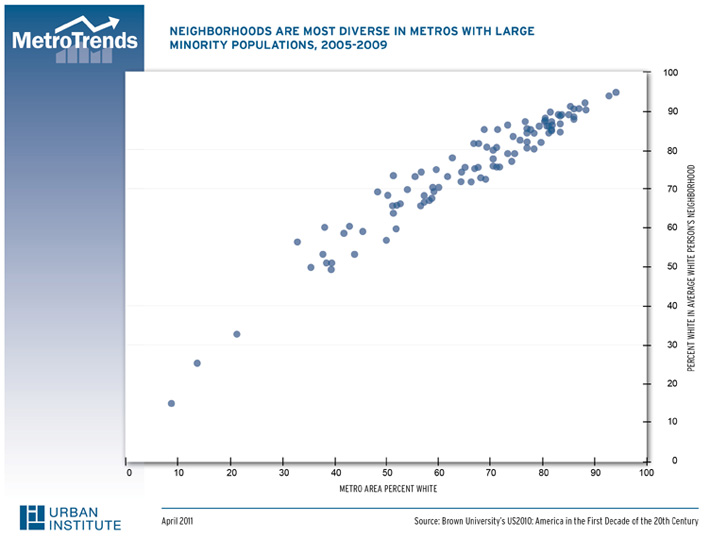
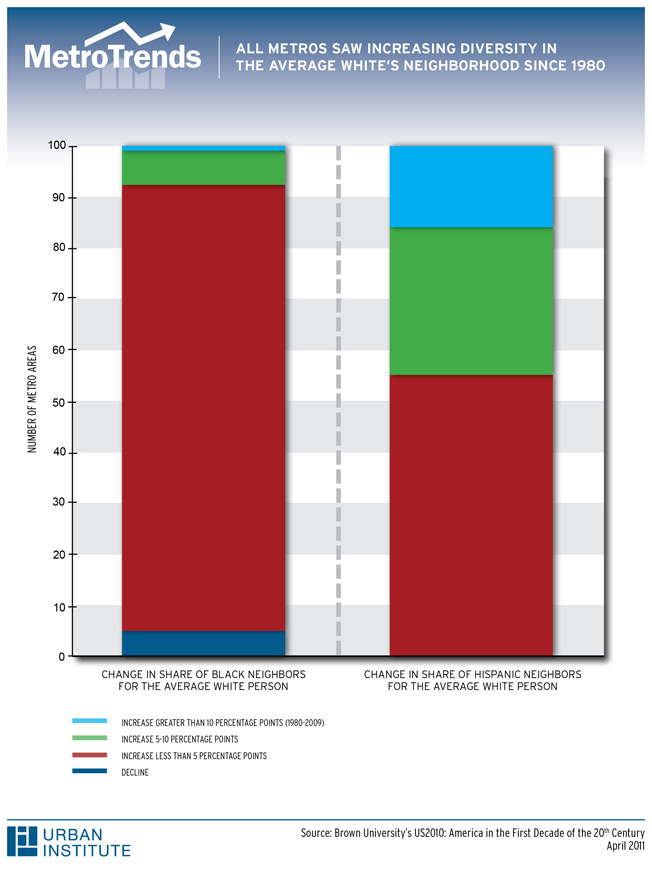
Neighborhood Diversity Neighborhood Diversity: Immigration Brings Big Changes to Urban NeighborhoodsDescribing the composition of the average white person's neighborhood is one of several ways to explore changing patterns of neighborhood segregation in a multi-ethnic nation like ours. Future commentaries will examine other indicators as well. In metropolitan America today, the average white American lives in a neighborhood where more than three quarters of his neighbors (77 percent) are also white. Seven percent are black, 10 percent are Latino, and 4 percent are Asian. That's considerably more diverse than three decades ago, when the average white (metropolitan) American lived in a neighborhood that was 88 percent white (5 percent black, 5 percent Latino, and 1 percent Asian). But this picture varies dramatically from one metropolitan area to another. Across the top 100 metros nationwide, the average white's neighbors range from only 15 percent white in McAllen, Texas to 95 percent white in Portland, Maine. In all but five of these big metros, the average white's neighbors are at least 50 percent white, but in the 30 metros with the lowest neighborhood diversity, the average white's neighbors are more than 85 percent white. These differences in neighborhood diversity largely reflect differences in the size of a metro area's non-white population. In metros where the whole population is predominantly white, the average white person is naturally more likely to live in a predominantly white neighborhood. But there are some important exceptions, mostly in the historically segregated metros of the Northeast and Midwest. In Detroit, Michigan, for example, the metropolitan population is only 68 percent white, but the average white lives in an 85 percent white neighborhood. And the Philadelphia metro's total population is only 67 percent white, but the average white lives in a 81 percent white neighborhood. Over the last three decades, metro areas across the US have become dramatically more diverse, and neighborhood segregation has slowly declined. In all of the top 100 metros nationwide, the average white person has more non-white neighbors today than in 1980. In 1980, there were only 7 big metros where the average white person's neighborhood was more than a quarter minority. These were mostly on the west coast and the Mexican border. Today, 41 of the top 100 metros -- including some in the south and midwest -- reflect this level of neighborhood diversity (at least 25 percent people of color in the average white's neighborhood). Although every big metro has seen increases in neighborhood diversity since 1980, the magnitude of these increases has varied widely, with the white share of the average white's neighborhood dropping by as little as 3 percentage points in the Youngstown metro area and as much as 27 points in the Riverside metro. In the 25 metros that saw the smallest change, the share of white neighbors for the average white person dropped by less than 7.1 points. In contrast, the share dropped by more than 13 points in the 25 metros with the biggest change. In general, the average white person's neighborhood changed the most in metros where the total minority population grew fastest. So, for example, the non-white share of total population in the Washington, DC metro area climbed 16 percentage points over the three decades, and the average white person's neighborhood dropped from 82 percent white to 66 percent white. But some metros with big increases in total minority population saw little change in neighborhood diversity. The share of non-whites living in the Milwaukee, Wisconsin region climbed 14 points since 1980, but the non-white share of the average white person's neighborhood increased only 8 points, from 7 percent to 15 percent today. Immigration (primarily from South and Central America) is the big trend that has made so many metros and some neighborhoods more diverse over the last three decades. Looking across all metros, the Hispanic share of population climbed 10 points since 1980, while the black share remained unchanged. In general, metros where the diversity of the average white's neighborhood has increased, it is primarily because of increases in Hispanic neighbors. In 16 of the top 100 metros, the share of Hispanics in the average white person's neighborhood climbed by more than 10 percentage points. Only one metro, Jackson, MS, saw comparable increases in the share of blacks living in the average white person's neighborhood. Conversely, the share of blacks living in the average white person's neighborhood declined slightly in 5 metros, while no metros saw declines the share of Hispanics. Research strongly suggests that many Americans want to live in racially and ethnically mixed neighborhoods (see for example, Promoting Neighborhood Diversity: Benefits, Barriers, and Strategies by Margery Austin Turner and Lynette Rawlings). And over the last three decades, white people in most big metros have seen the diversity of their neighborhoods increase. But most of this increase can be attributed to the growth of the Hispanic population, rather than to real reductions in long-standing patterns of black-white segregation. No single causal factor explains the persistence of segregation today. Instead, differences in information sources and in purchasing power combine with continued discrimination to limit progress. As the nation becomes more and more diverse, public policies must ensure that families aren't excluded from neighborhoods based upon race or ethnicity and that diverse neighborhoods aren't denied the services and amenities they need to thrive. All data are from Brown University's US2010: America in the First Decade of the 20th Century, a project dedicated to changes in American society in the recent past. Estimates of racial composition today derive from the 2005-2009 tract-level American Community Survey data, which are subject to sampling error and may be imprecise in small areas. |
Experts
Feedback
Send us your comments to help further the discussion. Share
Commentaries
|

 Margery Austin Turner
 Zachary McDade