|


|
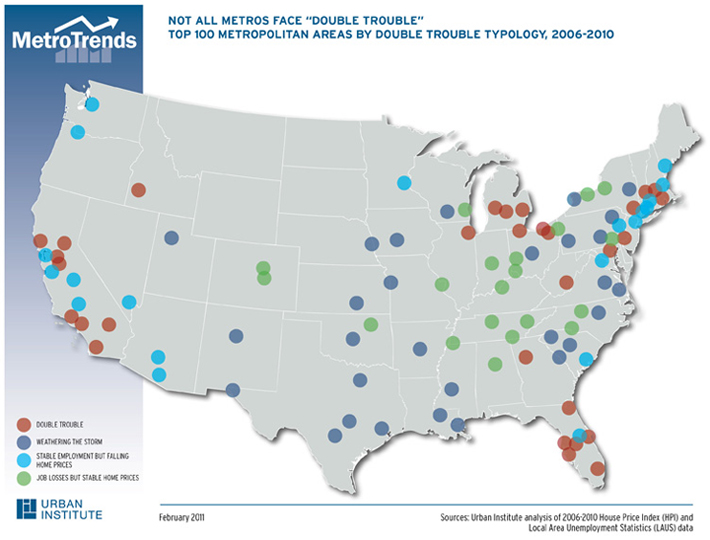
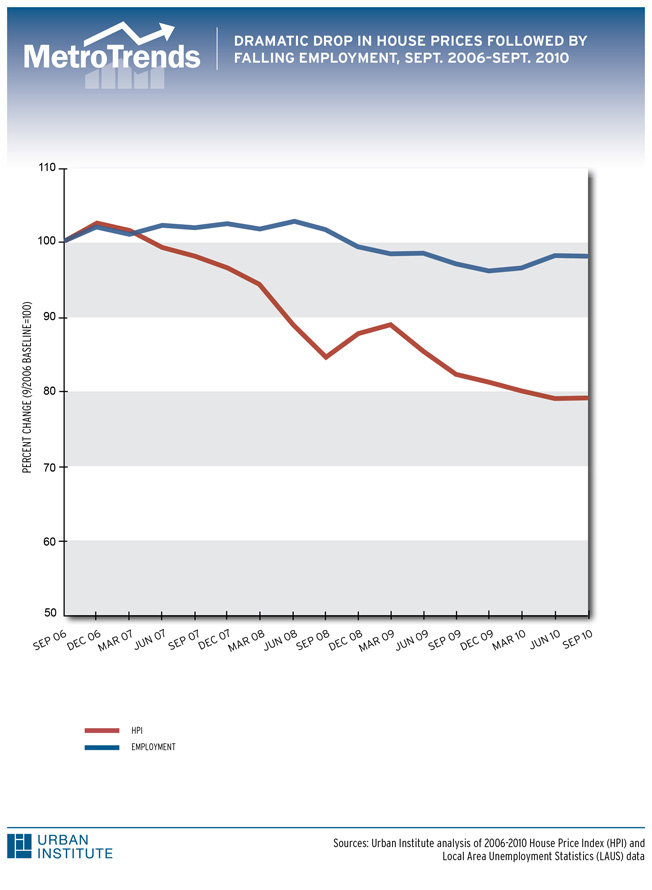
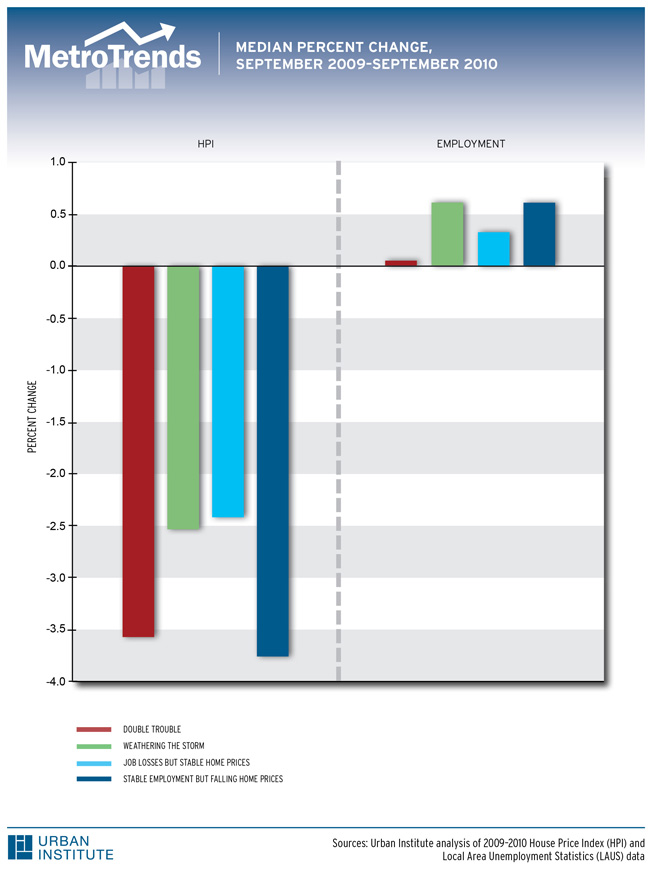
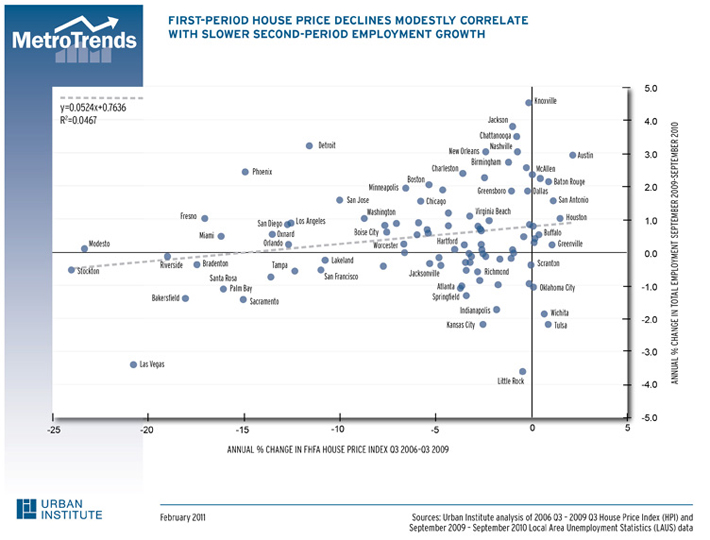
Double Trouble Double-Trouble Metros See Little ProgressThe largest 100 metro areas experienced vastly different changes in home prices and employment during the first phase of the nation's Great Recession. Our 2010 MetroTrends commentary highlighted the differences between 30 metros that suffered "double trouble" (above-average declines in both home prices and jobs) and 30 metros that were "weathering the storm" (below-average declines in both home prices and jobs). What has happened since? In particular, how have the double-trouble areas performed relative to other metro areas? Did the metros that weathered the storm through mid-2009 continue to do so? Which double-trouble metro areas recovered most? This commentary updates the story by examining trends between fall 2009 and fall 2010. For the average metro area, house prices continued to decline through fall 2010, while employment actually increased slightly. Among the top 100 metro areas, the median drop in house prices from fall 2006 to fall 2009 was about 11 percent (3.4 percent a year), compared with about 3 percent from fall 2009 to fall 2010. The median change in employment between 2006 and 2009 was -3 percent (-1.2 percent a year), compared with +0.4 percent between 2009 and 2010. One might have expected the metros hit hardest to recover most. But this pattern did not emerge. The double-trouble metros showed little sign of recovery from their sharp declines in 2006–09. Between fall 2009 and fall 2010, home prices fell another 5.2 percent on average in double-trouble metros, compared with only 3.8 percent in other metro areas. And employment was just as stagnant in double-trouble metros as in other metros. Only a few double-trouble metros performed better than the average in jobs or home prices. Detroit saw a 3 percent gain in employment after experiencing a 13 percent loss in the 2006–09 period. Several metro areas in California did better than the average in home prices, but only because they saw no further reductions. For example, home prices in the Riverside, San Diego, and San Francisco metros dropped by 61, 43, and 35 percent, respectively, between 2006 and 2009 and have been essentially flat since. Given such dramatic declines, one might have expected a faster recovery. What about the metros that managed to avoid big declines in both jobs and house prices in the early years of the Great Recession? The latest trends show them keeping pace with other metro areas on jobs and doing slightly better on home prices. For example, in Austin and Houston, Texas, jobs and home prices actually increased between 2006 and 2009; last year, home prices declined modestly but jobs continued to grow faster than in other areas. Other metro areas showing little change in jobs or home prices—in both 2006–09 and 2009–10–include Buffalo and Syracuse, New York, and Scranton and Pittsburgh, Pennsylvania. The association between job loss and weakness in the 2006–09 housing markets continued over the past year. Each 10 percent reduction in 2006–09 home prices was associated with a 0.16 percentage point additional decline in jobs. These findings heighten our concerns about the 30 metros identified as facing double trouble. They face formidable challenges to resuming growth in both jobs and house prices. |
Share
Feedback Commentaries Related Resources |