Our metropolitan spotlights focus on selected metros, showing how they're faring relative to others in their region and nationally.
Atlanta Metropolitan Area:
High population growth, employment losses adding to income woes
While no metro area has exited the recession unscathed, metropolitan Atlanta has suffered more than most. Its lack of employment opportunities and struggles in the housing market have earned metro Atlanta membership into the "Double-Trouble" club, a typology for the top 100 metros created by the Urban Institute that represents metros experiencing severe declines in employment and home prices. Further exacerbating the area's troubles is a decline in per capita income that is increasingly worrisome.
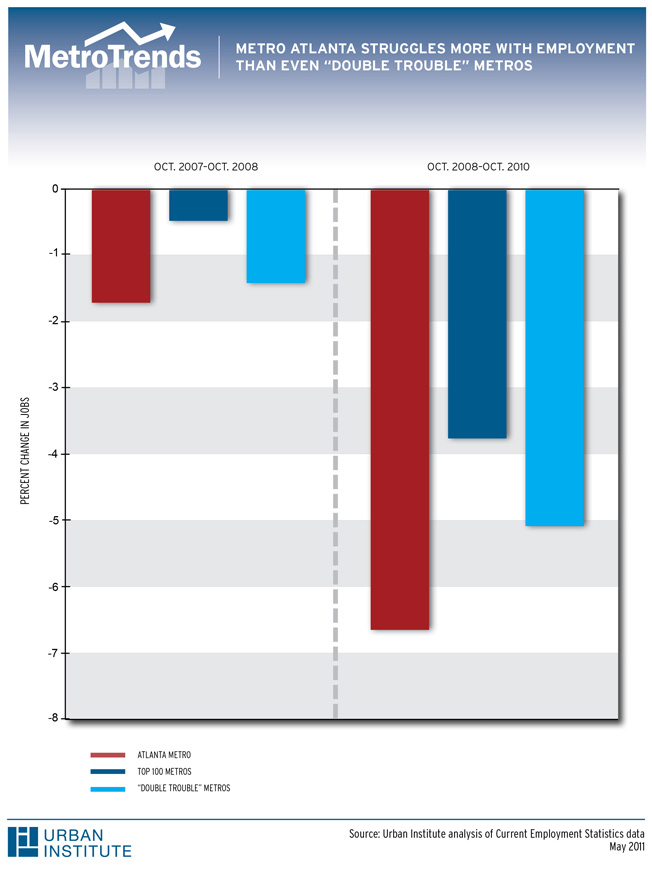
Atlanta's employment declines are greater than other "Double-Trouble" metros, with an almost seven percent decline in total employment between 2008 and 2010. Despite its relatively diverse job base and status as a national leader in job growth during the 1990s, metro Atlanta exited the 2000s with fewer jobs than what it began with - truly a lost decade.
view pdf

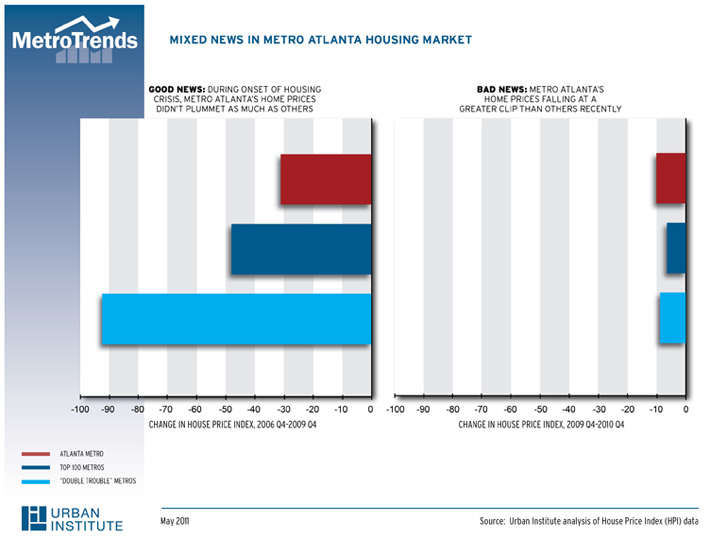
Continued employment declines have begotten continued home price declines. As the chart shows, metro Atlanta didn't experience the same level of home price decline as other metro areas during the early stages of the housing crisis. This was mostly due to the over-supply of homes and availability of cheap, undeveloped land that helped keep home prices relatively low in metro Atlanta, despite the area's explosive growth since the 1996 Olympics. Nevertheless, while other metros' home prices are recovering somewhat, prices in metro Atlanta continue their downward trend. According to some sources, metro Atlanta's home prices are back down to 1997 levels.1 Foreclosures continue to occur at historic rates, flooding the market with a shadow inventory that is suppressing prices, and home-building activity remains at an all-time low.
view pdf
To further complicate matters, metro Atlanta has experienced a 13.2 percent decline in personal, per capita income between 2000 and 2009, after adjusting for inflation.2 This represents the steepest decline among the 30 most populous metro areas. The only other metro area with a double-digit decline in per capita income between 2000 and 2009 is Detroit.
The reasons for this decline in metro Atlanta are twofold: the composition of the area's job losses and rapid demographic changes.
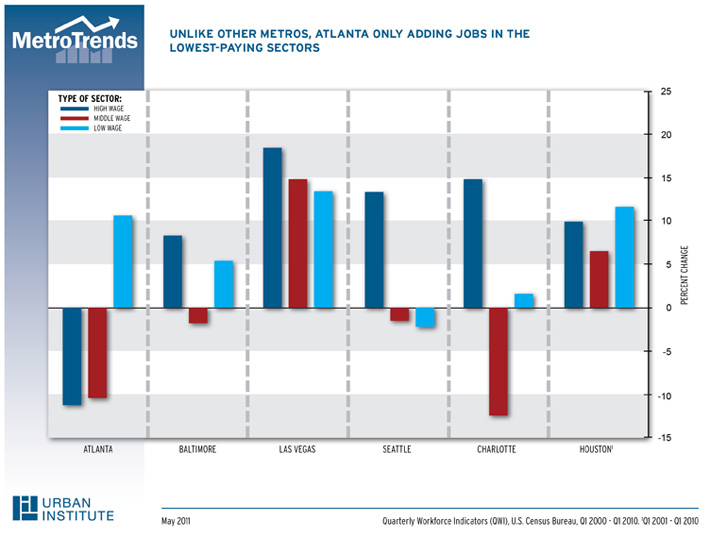
Metro Atlanta's employment profile is unique. In addition to losing approximately 11 percent of jobs in high- and mid-paying sectors, it added almost 11 percent of jobs in low-paying sectors. No other metro area experienced quite the same trends. Minneapolis and Chicago come the closest, but losses in high- and mid-paying sectors haven't been offset by such a large increase in jobs in low-paying sectors.3 Of course, any job is better than no job, but when an area is adding low-paying jobs and losing high-paying ones, overall income will suffer.
view pdf
Demographics play a key role too. Metro Atlanta added more than one million people during the 2000s, ranking third in overall population growth, behind only Dallas and Houston, according to the 2010 Census. A high proportion of this growth was from children. According to the American Community Survey (2008), metro Atlanta has a large and growing share of its population with children under 18. This helps keep metro Atlanta young, but it also serves as a drag on per capita income. The Fiscal Research Center in Georgia State University's Andrew Young School of Policy Studies recently found that, because of this change in demographics, Georgia's population per payroll job increased dramatically between 1996 and 2007, meaning that more people are being supported by fewer jobs. Read the brief here and the full report here.
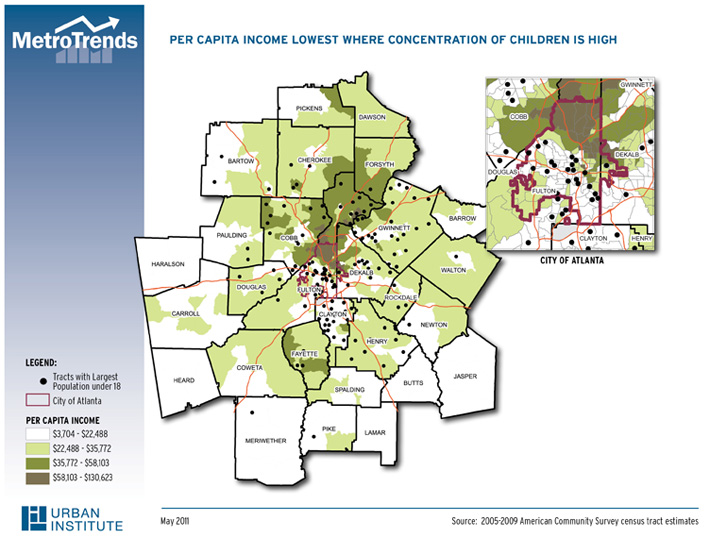
Like many other metro areas, the distribution of income is not equal in metro Atlanta. The map displays per capita income, by census tract, from the 2005 - 2009 American Community Survey. The black dots scattered throughout the map represent those areas with the highest concentrations of children under 18 (top 20% of census tracts). Areas with the highest incomes are concentrated in the northern parts of the region. Conversely, some of the lowest incomes in metro Atlanta are concentrated in the southern parts of the region, particularly in the south and west of the City of Atlanta, as shown in the inset. Also, the areas with the lowest incomes - those within the city of Atlanta and farther south in Clayton County - have some of the highest concentrations of children under 18.
view pdf
While all metro areas are struggling to adapt to the "new normal" - whatever this state may be - Atlanta is having a harder time than most. Atlanta's recovery in both the job and housing markets continues to lag its peers, and as a consequence, Atlanta is becoming a poorer place. But Atlanta still retains the assets that made it one of the fastest-growing metropolitan areas in the nation over the past two decades - the world's busiest airport, headquarters of several Fortune 500 companies, great climate and relatively affordable housing and land. The question remains, however, whether Atlanta can continue to capitalize on these assets after the "new normal" has arrived.
1Steve Palm, from SmartNumbers, a local housing data firm. As reported in the Atlanta-Journal Constitution.
2These data come from the Bureau of Economic Analysis (BEA), which defines personal income as the sum of wages and salaries; supplements to wages and salaries like tips; proprietors' income; dividends, interest, and rent; as well as personal transfers, whether from businesses, individuals, or government. BEA deducts contributions for government social insurance.
3For this analysis, "High-paying" jobs are those found in the Wholesale Trade, Information, Finance, Professional/Business and Management of Companies sectors, which are typically among the highest-paying sectors nationwide according to wage information from QWI. "Low-paying" jobs are those found in the Retail, Admin/Waste, Education, Arts/Entertainment, and Accommodation/Food sector, which, likewise, are typically among the lowest-paying sectors nationwide according to wage information from QWI. "Middle-paying" jobs are everything else. While there will be, of course, high-paying jobs in low-paying sectors and vice-versa, this is a good proxy for determining overall job quality in metro areas.